Visualizing Objects
In the Menpo Project, we take an opinionated stance that visualization is a key part of generating research. Therefore, we tried to make the mental overhead of visualizing objects as low as possible.
We also took a strong step towards simple visualization by integrating some of our objects with visualization widgets for the Jupyter notebook. Remember that our widgets live on their own repository, called menpowidgets.
We highly recommend that you render all matplotlib figures inline the Jupyter notebook for the best menpowidgets experience. This can be done by running
%matplotlib inline1. Visualizing Models
All menpofit models provide functionalities for visualizing themselves. For example,
the AAM that we trained in the Training section can be visualized with an interactive widget as:
%matplotlib inline
aam.view_aam_widget()
We can visualize only the multi-scale shape model as:
aam.view_shape_models_widget()
or the appearance models as:
aam.view_appearance_models_widget()
The same visualization widgets can be found in other models, such as ATM, CLM etc.
2. Visualizing Fitting Result
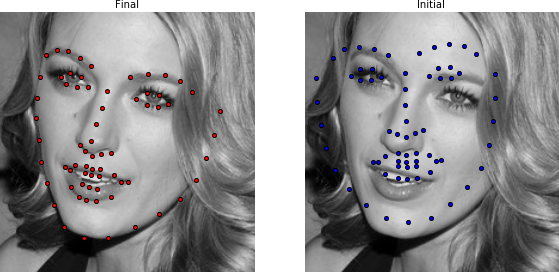
The fitting result objects shown returned by the fitting methods in the Fitting section can be easily visualized. Specifically, the initial and final shapes can be rendered as:
result.view(render_initial_shape=True)
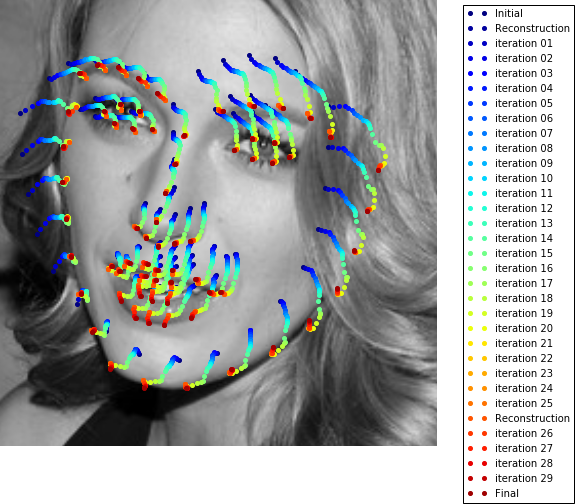
Similarly, the shapes acquired at each iteration can be visualized as:
result.view_iterations()
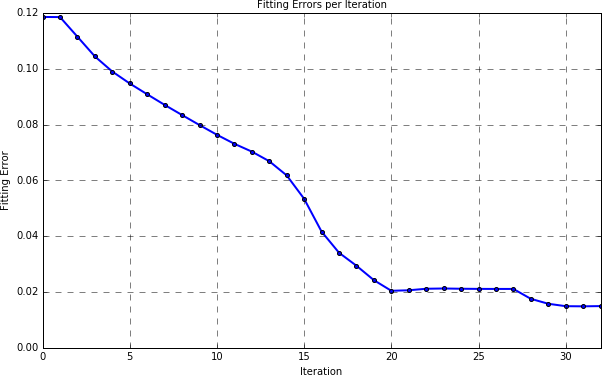
and the corresponding errors as:
result.plot_errors()
Finally, a fitting result can also be analysed through an interactive widget as:
result.view_widget()